The Infrastructure Cost of MoE Routing Replay
Published:
In the off-policy corrections post, we argued that routing replay — specifically R3, which replays the inference engine’s routing decisions during training — is the most effective correction for MoE models at moderate-to-high off-policiness. The async RL post confirmed this empirically: R3 was the single most impactful early fix, removing an entire source of mismatch at the infrastructure level.
But R3 has a cost the algorithmic analysis doesn’t see: every token’s routing decisions — which experts were selected at each MoE layer — must travel from the rollout engines to the training workers. For Qwen3-30B-A3B (48 MoE layers, top-8 routing, 128 experts), this is 768 bytes per token in routing data, versus 24 bytes for the token itself plus its logprob and loss mask. Routing data is 97% of the generation payload.
This post traces what that cost looks like in practice, why the bottleneck isn’t where you’d expect (it’s from the single-threaded manager, not bandwidth), and how we fixed it — including the “obvious” optimization that failed in an instructive way.
What Flows Between Rollout and Training
In slime’s disaggregated architecture [1], rollout engines (SGLang) and training workers (Megatron-LM) run on separate GPU clusters. Each training iteration requires two transfers:
Weight sync (training to rollout) uses NCCL broadcast: one training rank sends updated weights to all engine GPUs via a dedicated NCCL group (slime-pp_0). Weights are bucketed during transfer to bound peak memory — each bucket is all-gathered across TP ranks, converted from Megatron to HuggingFace format, then broadcast. This path works well and isn’t the focus of this post.
Generation data (rollout to training) is where routing replay creates the bottleneck. Each rollout batch produces:
| Field | Per token | Per batch (16M tokens) | Notes |
|---|---|---|---|
| Token IDs | 8 B | 0.12 GB | Output tokens |
| Log probabilities | 8 B | 0.12 GB | Per-token logprobs |
| Loss masks | 8 B | 0.12 GB | Which tokens contribute to loss |
| Routing decisions | 768 B | 12.3 GB | 48 layers x 8 topk x 2 bytes (int16) |
Routing data is 32x larger per token than everything else combined. Without routing replay, the generation payload is ~0.4 GB and transfers are invisible. With R3, it’s ~12.7 GB and suddenly transfer latency matters.
Why the Default Path Chokes
The generation data follows a relay path: engines send results via HTTP to a centralized rollout manager (a CPU-based Ray actor), which assembles the training batch, partitions it across DP ranks, and ships each partition to the corresponding training worker via Ray’s object store (ray.put / ray.get).
The Ray object store works well for small, heterogeneous payloads — it handles arbitrary Python objects (dicts, lists, mixed types) without any setup. For the non-routing data (~0.4 GB), it clears in well under a second. But at ~12.7 GB, a bottleneck emerges that isn’t about network bandwidth at all.
The bottleneck is the single-threaded rollout manager, not network transfer.
The rollout manager is a single-threaded Ray actor that does everything sequentially: collecting HTTP responses from engines, decompressing routing data, assembling the training batch (_convert_samples_to_train_data), partitioning across DP ranks (_split_train_data_by_dp), and calling ray.put for each partition — all under the GIL, all on one CPU core. At ~12.7 GB of routing data, this pipeline takes minutes end-to-end. Network bandwidth is not the constraint — even TCP-bound, 12.7 GB clears in seconds over InfiniBand.
This is counterintuitive: we have InfiniBand links capable of 50 GB/s, but the data spends most of its time being processed on a single CPU core.
The timing is also hard to diagnose. On the training side, data_preprocess wraps the entire receive path — ray.get (network fetch + deserialization) plus conversion of all fields to GPU tensors — and clocks in at 1-2 seconds. That’s fast. The minutes live entirely on the manager side, but they don’t surface in any manager-specific timer — they show up as inflated train_wait_time (training idle, waiting for the next batch). Without per-stage instrumentation inside the manager, the bottleneck looks like “rollout is slow” when the actual issue is the single-threaded data pipeline between rollout and training.
Fix: Dedicated NCCL Channel for Routing
The fix is to remove routing data from the Ray payload entirely and transfer it via a dedicated NCCL group (slime-routing) from the rollout manager’s GPU to the training workers’ GPUs:
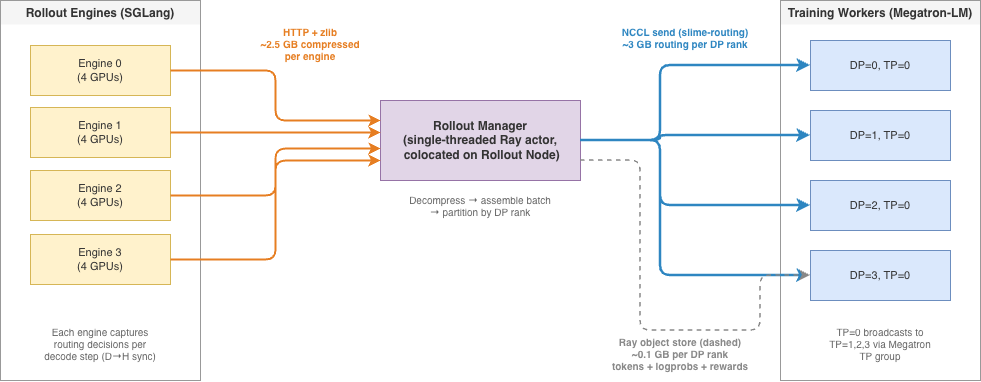
Only TP=0 workers receive — they broadcast to TP=1,2,3 via the existing Megatron TP group. The Ray payload drops from ~12.7 GB to ~0.4 GB.
| Ray object store | NCCL over InfiniBand | |
|---|---|---|
| Data path | GPU -> CPU -> serialize -> Plasma -> TCP -> deserialize -> CPU -> GPU | GPU -> NIC -> GPU (zero CPU copies) |
| Effective bandwidth | ~2-4 GB/s (limited by serialization + GIL) | ~50 GB/s (H200 NDR InfiniBand) |
| CPU involvement | Heavy (pickle, memcpy, GIL) | Near zero (DMA engine handles transfer) |
Synchronization
NCCL send/recv are matched operations — both sides must be active simultaneously. But in the async training loop, generate() must return before async_train() starts. If the send blocks inside generate(), it deadlocks.
Solution: generate() spawns a background thread for the NCCL sends, then returns immediately. Training workers post their NCCL recv when async_train() runs. The next generate() call joins the previous thread first (blocking briefly if the send hasn’t completed).
The Road Not Taken: Direct Engine-to-Training NCCL
The relay path (engines -> HTTP -> rollout manager -> NCCL -> training) still has costs: per-decode-step GPU-to-CPU sync inside SGLang’s routing capture, HTTP transit, manager-side decompression. The obvious next optimization is to cut out the middleman — have each SGLang engine send routing data directly to training workers via NCCL, keeping the data GPU-resident end-to-end.
We attempted this and hit issues at three layers, each independently fatal.
Layer 1: Engines don’t know which DP rank to send to (solvable)
The DP partitioning happens inside the rollout manager after all samples have been collected. The partition (round-robin or Karmarkar-Karp length-balanced) depends on a global view of all samples — their sequence lengths, ordering, and count after trimming. An individual engine only sees its own samples.
This is solvable: the partition only needs a list of sequence lengths (~1024 ints = 8 KB). Engines can allgather their lengths via NCCL, compute the same deterministic partition independently, and know which DP rank to target — no manager round-trip needed.
Layer 2: Engine-side scheduler deadlock (hard)
NCCL send/recv are matched operations — the engine-side send blocks until the training side posts a matching recv. The naive blocking implementation deadlocks immediately under dp_attention:
DP0 scheduler thread:
  POST /execute_routing_transfer -> NCCL send (work.wait())
  -> blocked: training is mid-weight-update, no recv posted yet
  -> Python thread blocked -> no CUDA kernels can launch

DP1, DP2, DP3 schedulers:
  process generate requests -> reach first MoE layer -> enter EP all-to-all
  -> all-to-all needs all 4 EP ranks -> waits for DP0
  -> DP0 can't launch CUDA kernels -> permanent deadlock
Removing the relay surfaces the engine-to-training timing mismatch that the rollout manager was previously absorbing.
Attempted fix: fire-and-forget — remove work.wait(), stash the work handle for lazy cleanup, let the scheduler return immediately. The engine-side deadlock goes away, but the training side times out waiting for the recv: in async DPPO the engine queues the send behind subsequent generate batches and only fires it long after training has given up.
Layer 3: CUDA stream poisoning (the fundamental constraint)
Even with a fully non-blocking design — fire-and-forget, no work.wait() anywhere on the engine — we hit the deepest issue.
NCCL kernels run on an internal work stream, but CUDA implicit cross-stream synchronization activates whenever tensors allocated on the default stream are consumed by NCCL ops on a different stream. The pending send (waiting for a matching recv that hasn’t been posted yet) creates an implicit dependency on the default stream. Inference GEMM kernels can’t launch. The scheduler times out, even though the Python thread is free.
Any NCCL operation that shares a CUDA context with inference is at risk of stream poisoning. A pending NCCL send — even one that never touches work.wait() in Python — blocks the default CUDA stream if it references tensors allocated there. This is a fundamental constraint of CUDA’s implicit synchronization model, not a bug in either NCCL or SGLang.
Fixing this would require either allocating routing tensors on a dedicated non-default stream and running NCCL on the same stream (invasive changes to SGLang’s GPU memory and stream management), or process isolation with a separate CUDA context (doesn’t exist in SGLang’s single-process scheduler). Neither is practical without deep engine changes.
Why the relay wins
Direct engine transfer was supposed to save GPU memory on the manager (avoiding the ~12.3 GB staging buffer) and eliminate the per-decode-step GPU-to-CPU sync. But:
- Wall-time was identical — both paths transfer ~3 GB/DP rank over RDMA; the manager relay’s NCCL leg is equally fast.
- The staging memory problem is solvable in the relay — bucketed sends (upload DP=0 -> send -> free -> DP=1 -> …) drop peak GPU staging to ~3 GB regardless of DP count.
- The relay manager runs NCCL on its own isolated GPU context, so stream poisoning is impossible.
- The per-decode-step GPU-to-CPU sync has to be addressed separately on the engine side regardless — it’s a cost of routing capture itself, not the transport.
The lesson: the rollout manager isn’t just a convenient relay — it’s an isolation boundary that decouples inference timing from training timing and keeps NCCL out of the inference CUDA context.
Independent Validation: Relax
Xiaohongshu’s Relax framework [2] — which shares roots with slime (SGLang + Megatron + Ray) — independently arrived at a structurally equivalent transport design: extract routing data from the serialized payload and broadcast via dist.broadcast over the TP group. Their reported R3 overhead is +1.9% of step time (vs +32% for veRL’s Ray-only path), consistent with our NCCL relay numbers.
One difference: Relax includes an engine-side optimization in SGLang. SGLang’s routing capture does a synchronous .cpu() after every forward pass, forcing a cudaStreamSynchronize that breaks the overlap scheduler. Relax patches this to be fully async — GPU staging buffer, dedicated copy stream, deferred scatter on next flush — claiming ~20% rollout latency savings. This cost is orthogonal to the transport fix (it exists in both the Ray and NCCL paths) and is the main remaining R3 overhead in our setup.
Scaling: What Breaks at R1 Scale
The current setup uses Qwen3-30B-A3B (48 MoE layers) at 16k context. What happens at DeepSeek R1 scale (60 MoE layers, 128k outputs)?
Per-token routing cost scales linearly with MoE depth: 48 layers x 8 topk x 2 bytes = 768 bytes (Qwen3-30B-A3B), versus 60 layers x 8 topk x 2 bytes = 960 bytes (R1). The total payload scales with total tokens per batch:
| Config | Total tokens | Routing payload | NCCL time (50 GB/s) | Staging GPU memory |
|---|---|---|---|---|
| Qwen3-30B-A3B (48L, 1024 x 16k) | 16M | 12.3 GB | ~250 ms | ~12.3 GB |
| R1 (60L, 1024 x 16k) | 16M | 15.4 GB | ~300 ms | ~15.4 GB |
| R1 (60L, 512 x 32k) | 16M | 15.4 GB | ~300 ms | ~15.4 GB |
| R1 (60L, 512 x 128k) | 64M | 61.4 GB | ~1.2 s | ~61.4 GB |
| R1 (60L, 1024 x 128k) | 128M | 122.9 GB | ~2.5 s | ~122.9 GB |
Total tokens per batch is the scaling factor, not sequence length alone — 512 samples at 32k and 1024 at 16k produce the same routing payload. Going from Qwen3-30B-A3B to R1 at the same token budget adds ~25% from the deeper MoE (48 to 60 layers). The real jump comes from scaling the token budget for longer contexts.
Bucketed sends resolve the main bottleneck
The first wall is NCCL staging memory. The coalesced-send approach requires all DP rank tensors alive on the manager’s GPU simultaneously. At 128M tokens, the staging buffer alone is 123 GB — nearly filling a 140 GB GPU that’s shared with an SGLang engine.
The fix is bucketed sends: upload one DP rank’s data to GPU, send via NCCL, free, repeat. Peak GPU staging drops to ~3 GB (one DP rank’s share) regardless of total payload size. The NCCL transfer time itself stays manageable — even 123 GB at 50 GB/s is ~2.5 seconds. This is the same bucketing principle used in the weight sync path, applied in reverse.
At extreme scale (128M+ tokens), other legs of the pipeline start to matter too: HTTP collection of compressed routing data (~25 GB at 5x compression, ~20 seconds at 10 Gbps), non-routing Ray payload growing to ~370 MB per DP rank, and manager CPU memory for holding all routing arrays before partitioning. These are addressable but would need their own redesigns — the NCCL staging fix buys significant headroom before they become blocking.
Quantization is tempting but model-dependent. Qwen3-30B-A3B has 128 experts (IDs 0-127) and DeepSeek R1 has 256 (IDs 0-255) — both fit in uint8. But we use int16 for forward compatibility: DeepSeek V4 has 384 routed experts, which overflows uint8 (max 255). Int16 covers up to 32,767 experts with no code changes when switching models.
What We Learned
Profile the right leg. The transfer bottleneck was the single-threaded rollout manager processing ~12.7 GB of data sequentially, not network bandwidth. Training-side data_preprocess — which includes the full ray.get fetch, deserialization, and GPU tensor conversion — showed only 1-2 seconds. The minutes were entirely on the manager side (HTTP collection, decompression, batch assembly, partitioning, serialization), but surfaced only as inflated train_wait_time — a timer that doesn’t distinguish “waiting for rollout to finish generating” from “waiting for the manager to finish processing.” Per-stage instrumentation inside the manager was what finally identified the bottleneck.
Match the transport to the payload. Ray’s object store is the right tool for small, heterogeneous data (tokens, logprobs, rewards — arbitrary Python dicts). NCCL is the right tool for large, homogeneous data (routing tensors — one dtype, one shape pattern, GPU-to-GPU). Trying to push 12+ GB through Ray’s pickle path is using the wrong tool, and trying to push Python dicts through NCCL is equally misguided. Separate the payloads and use the appropriate transport for each.
Respect CUDA context boundaries. The direct engine-to-training NCCL attempt taught us that you cannot safely mix NCCL operations with an inference engine’s CUDA context. A pending NCCL send — even one that’s fully non-blocking in Python — can poison the default CUDA stream via implicit cross-stream synchronization. The rollout manager isn’t overhead; it’s an isolation boundary.
Design for the scaling wall. At current scale (Qwen3-30B-A3B, 48 MoE layers, 16k context), the NCCL relay handles routing data in ~250 ms. At R1 scale (60 layers, 128k), the same architecture needs bucketed sends for memory, and the HTTP collection leg becomes the new bottleneck. Each fix shifts the bottleneck rather than eliminating it — build with enough instrumentation to see where it moves next.
References
[1] THUDM. “slime: Scalable LLM Inference and Megatron Engine.” GitHub.
[2] RedAI-Infra. “Relax: Omni-Modal RL Framework.” GitHub.
[3] Off-Policy Corrections in LLM RL Training — The five sources of distribution mismatch, including MoE routing (Source 4).
4 Stabilizing and Scaling Async RL Training — Practitioner account of using R3 routing replay in async MoE training. (Coming soon)